Market making in sports prediction contracts requires a sophisticated framework that combines dynamic spread models, inventory rebalancing rules, and risk limits tailored to your trading scale. The explosive 90% year-over-year growth in 2026 has created unprecedented opportunities for both retail and institutional market makers.
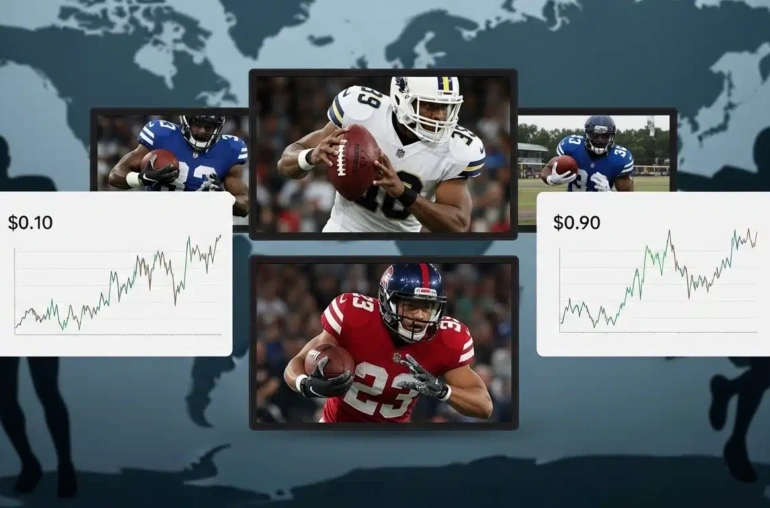
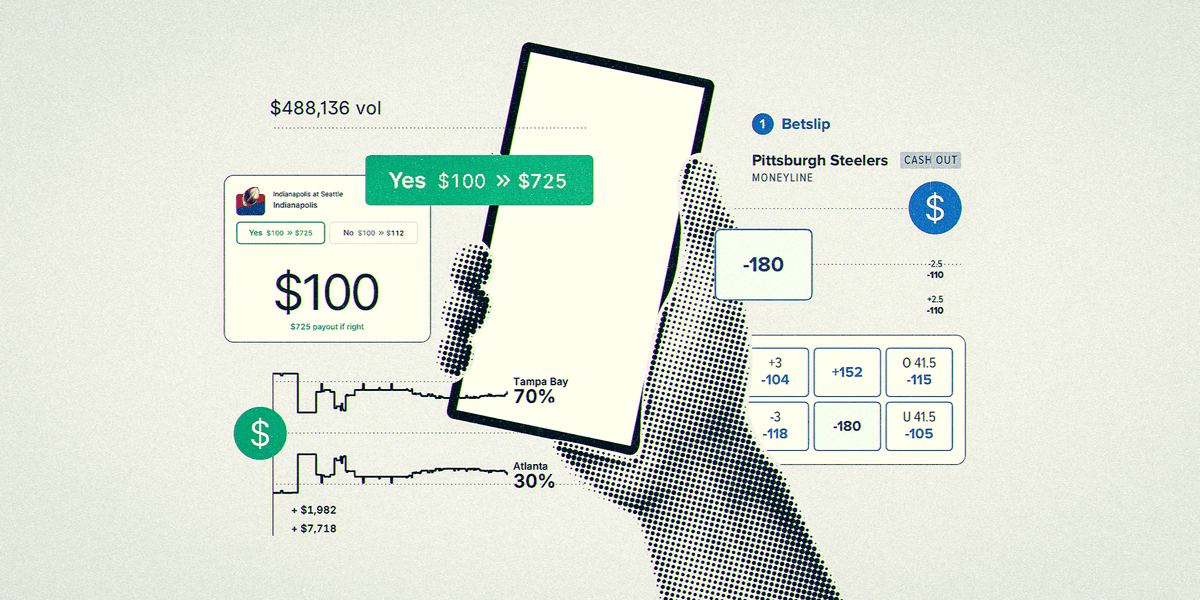
The sports prediction market landscape has transformed dramatically in 2026, with platforms like Kalshi and Polymarket experiencing unprecedented volume growth. This explosive expansion has created a unique window for market makers to profit from providing liquidity across dozens of sporting events simultaneously. Unlike traditional sports betting where you simply take positions, market making involves continuously quoting bid and ask prices to facilitate trades between other participants while capturing the spread.
The key differentiator between successful and failed market makers lies in their technical framework. While retail traders often rely on gut instinct or basic price levels, professional market makers deploy sophisticated algorithms that adjust spreads in real-time based on implied volatility, inventory position, and order flow dynamics. This systematic approach has become essential as the market has matured and competition for liquidity has intensified.
Dynamic Spread Models Tied to Implied Volatility

Optimal spread width = Base Spread × (1 + k × σ) where σ represents implied volatility and k is the inventory sensitivity parameter. Retail market makers should use base spreads of 0.5-1.0%, while institutional desks operate with tighter 0.1-0.3% spreads.
Spread modeling forms the foundation of profitable market making. The relationship between spread width and implied volatility follows a predictable pattern: as uncertainty increases, wider spreads compensate for the additional risk. For sports contracts, implied volatility spikes during key moments like team news announcements, weather changes, or in-game momentum shifts that can swing probabilities by 5-15%.
Retail market makers often make the critical mistake of using static spreads regardless of market conditions. This approach leaves money on the table during low-volatility periods while exposing them to excessive risk during volatile events. The dynamic model adjusts automatically, tightening spreads when markets are calm and widening them during uncertainty. For example, a football game with stable weather might warrant 0.5% spreads, while the same game with a questionable star player could justify 1.2% spreads.
Calculating Implied Volatility for Sports Contracts
Implied volatility for sports prediction contracts can be estimated using the Black-Scholes framework adapted for binary outcomes, with adjustments for event-specific factors like team news and weather conditions that can shift market probabilities by 5-15%.
Sports contracts present unique challenges for volatility calculation compared to traditional financial markets. The binary nature of outcomes means standard Black-Scholes assumptions require modification. Instead of continuous price distributions, sports contracts have discrete jumps between 0 and 100% probability. This requires a modified approach that accounts for the all-or-nothing payoff structure — betting on sport.
Real-time volatility estimation involves analyzing recent price movements and order flow patterns. A sudden influx of buy orders might indicate insider information or breaking news, temporarily increasing implied volatility. Market makers should update their volatility estimates every 30-60 seconds during active trading periods, using a weighted average of recent price changes and order imbalance metrics. This dynamic approach ensures spreads remain appropriately compensated for current market risk (prediction market order book strategies for sports).
Inventory Rebalancing Rules for Market Makers
Threshold-based rebalancing should trigger when inventory exceeds ±20% of target position, with time-based rebalancing every 15-30 minutes for high-volume contracts. Risk-adjusted sizing follows the formula: Position size = (Risk Budget) / (σ × √time Horizon).
Inventory management represents the most critical risk factor for market makers. Accumulating excessive directional exposure can transform a liquidity provider into a speculative trader with significant losses. The threshold-based approach provides clear triggers: when long positions exceed 120% of the target inventory level, it’s time to sell; when short positions drop below 80%, buying pressure is needed.
Time-based rebalancing adds another layer of protection, particularly for contracts with limited trading windows. A basketball game might only trade for 2-3 hours, making frequent rebalancing essential. The 15-30 minute interval balances transaction costs against risk exposure, ensuring positions don’t drift too far from neutral. For longer-duration contracts like season-long championship markets, weekly rebalancing might suffice (using prediction markets for live sports trading).
Automated Quoting Logic Implementation
Automated quoting systems should adjust bid-ask spreads in real-time based on order flow imbalance, updating quotes every 500ms for liquid contracts and every 2-3 seconds for less active markets to maintain competitive positioning.
Modern market making relies heavily on automation to process the massive data flows involved. A typical NFL Sunday might involve 50+ games with contracts updating every few seconds. Manual quoting simply cannot keep pace with the required adjustments. Automated systems monitor multiple data streams simultaneously: current inventory levels, recent trade prices, order book depth, and implied volatility estimates.
The two-tier quoting approach optimizes competitiveness while protecting against adverse selection. Within 5% of the mid-price, quotes remain tight to capture retail flow. Beyond that range, wider quotes protect against informed traders who might have superior information. This gradient approach has proven more profitable than fixed spread models, particularly in less liquid markets where information asymmetry is higher (best prediction markets for horse racing 2026).
Risk Limits: Retail vs Institutional Market Maker Desks
Retail market makers should cap exposure at 5% of capital per contract with 2% daily Value at Risk (VaR), while institutional desks can extend to 15% per contract and 5% daily VaR due to deeper liquidity pools and sophisticated risk management systems.
Risk management frameworks differ dramatically between retail and institutional market makers. Retail traders typically operate with $10,000-100,000 capital bases, requiring conservative position sizing to survive inevitable drawdowns. The 5% per-contract limit ensures that even complete contract losses don’t devastate the overall portfolio. Daily VaR limits of 2% provide additional protection against black swan events (difference between binary options and sports bets).
Institutional desks manage $10 million+ capital bases with dedicated risk teams and sophisticated monitoring systems. Their ability to absorb larger positions stems from diversification across hundreds of contracts and the capacity to hedge risks in correlated markets. However, this increased leverage requires equally sophisticated risk controls. Daily VaR limits of 5% might seem aggressive, but they’re supported by real-time monitoring that can halt trading within seconds of limit breaches (how to open a prediction market sports account 2026).
Platform-Specific Risk Management Features
Kalshi’s CFTC-regulated framework provides automated circuit breakers and position limits, while Polymarket offers more flexible risk parameters but requires manual oversight for compliance with 2026 regulatory requirements.
Platform selection significantly impacts market making strategies. Kalshi’s regulatory framework provides institutional-grade risk management tools, including automated circuit breakers that pause trading during extreme price movements. These features protect market makers from flash crashes and other anomalies. However, Kalshi’s stricter position limits can constrain larger trading strategies.
Polymarket’s crypto-based infrastructure offers greater flexibility but requires more active risk management. The absence of automated circuit breakers means market makers must implement their own safeguards. Additionally, Polymarket’s settlement via smart contracts introduces smart contract risk that must be factored into overall risk calculations. The platform’s higher volatility can create more opportunities but also requires tighter risk controls (crypto-native sports betting on Polymarket 2026).
Building Your Market Making Infrastructure for 2026
Successful market making requires API integration with multiple platforms, real-time data feeds with sub-second latency, and automated risk monitoring systems that can process thousands of contracts across dozens of sporting events simultaneously.
The technical infrastructure requirements for modern market making cannot be overstated. Sub-second latency is essential for maintaining competitive quotes, particularly in liquid markets where other market makers might react to news within milliseconds. This requires direct API connections rather than web-based interfaces, along with co-located servers near exchange data centers when possible.
Data management presents another significant challenge. A typical market making operation might track 10,000+ contracts across multiple platforms, each updating multiple times per second. Efficient data structures and caching mechanisms become essential for maintaining performance. Cloud computing infrastructure provides the scalability needed to handle peak loads during major sporting events, when contract volume might increase 10x compared to normal trading periods.
Essential Tools and Technologies for Market Makers
Key technologies include Python-based trading bots with WebSocket connections, cloud computing infrastructure for scalability, and machine learning models for volatility forecasting and spread optimization across different sports categories.
The technology stack for market making has evolved significantly. Python remains the dominant language due to its extensive libraries for data analysis and trading infrastructure. WebSocket connections provide the real-time data feeds essential for timely quote updates. Cloud platforms like AWS and Google Cloud offer the computational resources needed for processing large datasets and running complex algorithms.
Machine learning models have become increasingly important for predicting volatility and optimizing spreads. Models trained on historical data can identify patterns that human traders might miss, such as the relationship between weather conditions and contract volatility in outdoor sports. These models continuously learn and adapt as new data becomes available, improving their predictive accuracy over time (zero-spread sports betting on prediction markets).
Performance Metrics and Optimization Strategies
Market makers should track key performance indicators including spread capture rate (target 15-25% of theoretical optimal), inventory turnover ratio (target 3-5x daily), and realized vs. implied volatility arbitrage opportunities.
Performance measurement requires tracking multiple metrics simultaneously. Spread capture rate measures how effectively a market maker captures the available spread compared to theoretical optimal pricing. A rate of 15-25% indicates efficient quote placement and competitive positioning. Below this range suggests either overly wide spreads or poor quote timing.
Inventory turnover ratio measures how quickly positions are closed and reopened. Higher turnover generally indicates more efficient capital utilization, but excessively high turnover might suggest over-trading or inadequate position sizing. The 3-5x daily target balances capital efficiency against transaction costs. Realized vs. implied volatility arbitrage opportunities represent situations where actual price movements differ from predicted volatility, creating potential profit opportunities for sophisticated market makers.
Continuous optimization involves analyzing these metrics to identify areas for improvement. If spread capture rates are low, adjustments to quoting algorithms might be needed. If inventory turnover is too slow, position sizing rules might require revision. The most successful market makers treat their operations as ongoing experiments, constantly testing and refining their approaches based on performance data.