The crypto market’s upward momentum has continued this week, complementing the previous week’s parabolic price movement. Bitcoin has strengthened nearly 27% in the past 30 days and 108% year-to-date. One trigger for the October rally was the appearance of the iShares Bitcoin Trust ETF’s ticker symbol (IBTC) on the DTCC website.
David Duong of Coinbase Research sees bitcoin’s price performance diverging from other cryptocurrencies, especially due to the sharp -28% decline of the ETHBTC pair. Ethereum has now weakened significantly against bitcoin, with Duong criticizing ETH for its “lack of a fundamental investment narrative.” The expert also points out that the trading volume has increased from $31 billion in September to $47 billion in October.
“That said, bitcoin has been outperforming the rest of the digital asset class, reflected in the ETH/BTC cross, which is down for its fourth consecutive week to new yearly lows. Part of the reason why is that ETH market makers have been long gamma while the market has been focused on spot bitcoin ETFs. Although technicals suggest this could be the precursor to some mean reversion, the lack of a strong fundamental narrative for Ethereum puts constraints on our conviction.”
Raoul Pal, known as a dedicated crypto bull, published an extensive set of charts this week that reflect the relationship between the M2 money supply and bitcoin price development. From a technical standpoint, the inflection point of the money supply and bitcoin at the turn of the year and nearly a 12-month upward trend clearly exhibit a correlation.
Pal has long been talking about the central bank policy inflection point, where quantitative tightening (QT) would shift to quantitative easing (QE). As a high-beta risk asset, bitcoin has clearly benefited from the effects of the “cheap dollar” and zero interest rate cycle. In previous years, cheap credit flowed abundantly into assets like the NFT market.
[image-1]
Sources: Raoul Pal, GMI
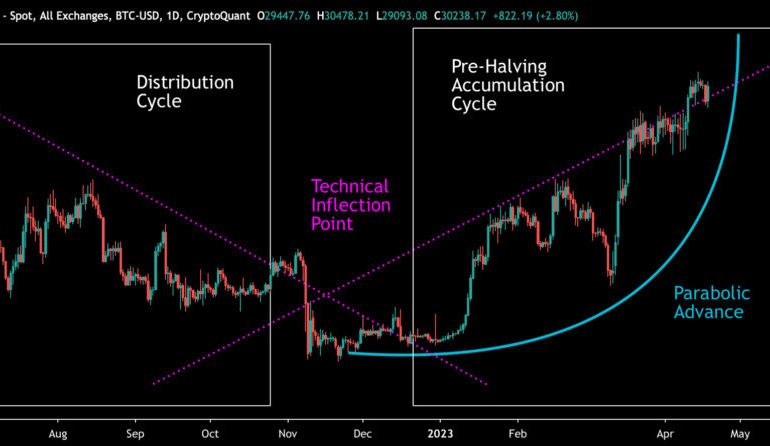
From a purely technical perspective, bitcoin entered a new price discovery cycle in October (white), aiming towards the $40 000 to $50 000 valuation levels. At the same time, two significant macro events are supporting bitcoin’s price aspirations: the anticipated launch of a spot ETF and the spring 2024 halving event.
Following the distribution cycle from 2020 to 2022 (purple), bitcoin reached its price bottom and capitulation phase at the turn of 2022 and 2023. The leading digital asset is now in a new pre-halving accumulation cycle (turquoise). Using the 2021 price peak as a reference point, the transition from $69 000 to $100 000 would represent a reasonable 45% increase percentage-wise. In a multi-year perspective, the $100 000 target is certainly achievable.
[image-2]
Sources: Timo Oinonen, CryptoQuant
The Material Indicators’ heat map illustrates bitcoin’s attempt to break through the $35 000 resistance level, which has thus far thwarted its upward momentum. The cumulative volume delta (CVD) indicates strong short-term demand from whales but a temporary decrease in other groups.
[image-3]
The crypto market, which has been climbing strongly for the past two weeks, is now taking a brief breather as bitcoin seeks to break through the $35 000 level. After a weak year for high-beta tokens, they are showing signs of awakening, with XRP (7,7%), Aave (6,3%), and Stellar (5,7%) notably strengthening on a weekly basis. Following David Duong’s theses, the growing divergence between the crypto market and the largely sideways-moving stock market is a fact.