The cryptocurrency market has maintained a moderately positive sentiment over the past week, with Bitcoin, the leading digital asset, showing a modest gain of 0.2 percent. In contrast, Ethereum has experienced a more significant rally, climbing over 10 percent within the same period, primarily driven by the successful implementation of its Shapella (Shanghai + Capella) update.
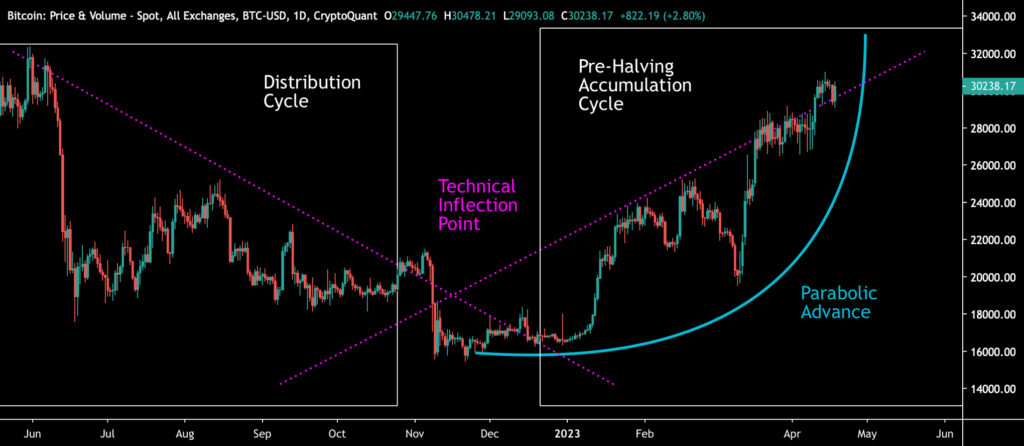
From a technical perspective, Bitcoin crossed a crucial inflection point at the start of the year. This point, where descending and ascending trend lines converge, acts as a pivotal watershed, defining the market’s trajectory from 2021 through to the anticipated halving year of 2024.
Simultaneously, Bitcoin has been tracing a parabolic trendline since December 2022. However, this parabola is currently steepening, necessitating increasingly larger price surges to maintain its path. A break below this parabolic trendline during the spring could trigger short-term selling pressure in the market.
Sources: Timo Oinonen, CryptoQuant
In a broader context, Bitcoin’s market behavior typically cycles through distinct accumulation and distribution phases. Historically, institutional capital tends to favor accumulation cycles, while retail investors are more active during distribution phases. These cycles are also influenced by Bitcoin’s halving events, which are consistently preceded by a pre-halving accumulation period.
Analyzing Material Indicators’ heat map reveals Bitcoin’s dip from $30,000 to $29,000 earlier in the week, following the disappearance of a significant buy wall. Nevertheless, renewed buying pressure emerged below the $30,000 mark, propelling Bitcoin back above this level. Currently, a moderate sell wall is observed above $31,000.
Last week, Bitcoin’s Bollinger bands compressed the spot price upwards, a phenomenon known as a BB Squeeze. It now appears that an expansion phase is imminent, typically characterized by a sideways movement in the spot price, referred to as a BB Expansion.
Sources: Timo Oinonen, CryptoQuant
Contrary to earlier speculations, selling pressure surrounding Ethereum’s upgrade did not materialize. Instead, Ethereum is currently leading the price performance among large-cap assets. The market for smaller tokens is also showing clear signs of revival, with Chainlink (LINK) surging almost 17 percent in a week. Litecoin (LTC) has also seen an 8 percent increase in the past week, with its halving event approximately 100 days away.
The broader mainstream market has experienced slower growth, with the S&P 500 index rising by 1.1 percent, while gold has slightly weakened by about 0.6 percent. The technology-focused Nasdaq-100 index has enjoyed a strong tailwind in April, achieving over 20 percent growth since the beginning of the year.
7-Day Price Performance Overview
Bitcoin (BTC): 0.2%
Ethereum (ETH): 10.8%
Litecoin (LTC): 7.7%
Aave (AAVE): 3.1%
Chainlink (LINK): 16.7%
Uniswap (UNI): 6.1%
Stellar (XLM): 0.2%
XRP: 2.0%
S&P 500 Index: 1.1%
Gold: -0.6%
Bitcoin’s UTXO Pattern: A Repeat of 2020?
Fueled by its recent price increase, Bitcoin is now exhibiting a clear divergence from the realized price’s turquoise wave, which served as a critical battleground at the turn of 2022 and 2023. The realized price is often considered a market watershed, as it represents the average price at which all Bitcoins were purchased. When the spot price surpasses the realized price, it indicates that Bitcoin investors are, on average, profiting from their investments.
For many years, the realized price UTXO waves have accurately signaled Bitcoin’s market bottoms. In 2019, the decline of the 6M-12M wave below the 12M-18M wave (the ‘utxo cross’) marked a market bottom. This identical pattern recurred in 2020. The phenomenon was observed again at the end of 2022, with the 6M-12M wave sinking significantly below the 12M-18M wave, and their divergence increasing. The convergence of these UTXO waves in late 2022 can therefore be interpreted as a confirmation of the market bottom.
Sources: Timo Oinonen, CryptoQuant
Currently, Bitcoin is exhibiting a setup reminiscent of 2020, where the 6M-12M wave of realized price, descending from above, intersects with the spot price, ascending from below. The chart illustrates the 2020 scenario in the green area on the left, with the current situation depicted on the right. The outcome of this intersection in 2020 was a parabolic price rally that extended well into 2021.
Bitcoin’s Dominance and the Prospect of an Altseason
With Bitcoin boasting nearly 100 percent year-to-date gains, many traders are now anticipating significant movements in alternative cryptocurrencies, or altcoins. While Bitcoin’s relative dominance has grown throughout the spring, its dominance growth is projected to be capped at 50 percent.
In recent years, Bitcoin’s dominance has consistently found a ceiling at 50 percent, largely due to increased retail participation during bull cycles. As Bitcoin gains critical momentum, demand for altcoins tends to correlate, leading to market saturation and a sideways movement in dominance. These combined factors create the conditions for an ‘altseason’ to emerge.
According to the efficient market hypothesis (EMH), asset prices should reflect all available information. However, speculative, higher-beta tokens often challenge this hypothesis. The market frequently exhibits information asymmetry, where certain participants possess superior information. Additionally, new crypto investors often show a preference for novel tokens due to their perceived innovation and potential.
Despite Ethereum’s Shapella update surpassing market expectations, the smart contract platform is not yet demonstrating a ‘flippening’ scenario relative to Bitcoin. Currently, Ethereum’s market capitalization stands at approximately $250 billion, representing 42.7 percent of Bitcoin’s dominant market cap of $588 billion.
Our Triple Bottom Structure Prediction Confirmed
The triple bottom structure, derived from the number of active addresses, has now been clearly confirmed. This model was initially presented in our technical analysis from week nine, and the graph of active addresses (white) has now risen beyond the turquoise area.
On-chain data from 2018 and 2019 illustrates how the number of active addresses (using a 30-day weighted moving average, 30WMA) formed three distinct bottoms (turquoise, left) as part of the 2018-2019 market reversal. The 2021-2023 cycle exhibits a similar structure (turquoise, right), with active addresses also reaching three individual lows.
Sources: Timo Oinonen, CryptoQuant
It’s notable that the number of active addresses began to decline as early as summer 2021, effectively serving as a leading indicator for the spot price. Consequently, the price action in spring 2021 can be considered a de facto peak supported by fundamentals, while the November 2021 peak might be viewed as a ‘secondary’ peak.
In summary, with Bitcoin mirroring the triple bottom structure observed in the last major cycle, a gradual price increase is likely to continue throughout 2023. Bitcoin’s current ‘fair price’ is estimated at $38,736, aligning with our most recent price projection of $46,092.
Key Developments We Are Monitoring
Solana Mobile has announced that it will commence shipping its Saga smartphone on April 20th. The device carries a retail price of $1,000 in the USA, which translates to approximately 912 euros in the Eurozone. Alongside the shipping announcement, Solana has provided further insights into the device’s functionality and its integrated ecosystem.
New Saga owners will receive an exclusive Saga genesis token, which promises access to unique content and offers. Additionally, Saga users are slated to receive a starter pack containing 20 USDC and 0.01 SOL tokens for transaction purposes. We are closely tracking the evolution of this crypto-native smartphone.
In a recent interview with Kitco, investment expert Lawrence Lepard shared his perspective on Bitcoin, explaining why he believes the cryptocurrency could reach $100,000 next year. [video-1]
Bitcoin OG Matthew Mezinskis, renowned for his Crypto Voices podcast, delves into the historical context of how central banks have traditionally impeded free banking. Mezinskis also offers his insights on the current state of the credit market. [video-2]