Sports betting odds are fundamentally based on probability theory and statistical modeling. Bookmakers employ complex algorithms that analyze vast amounts of historical data, team performance metrics, player statistics, and situational factors to calculate the true probability of each possible outcome.
The core principle is converting probability percentages into betting odds. For example, if a team has a 50% chance of winning, the fair odds would be 2.00 in decimal format (1/0.50 = 2.00). However, bookmakers add a margin (vig or juice) to ensure profitability, typically resulting in odds like 1.91 instead of 2.00.
- Bookmakers use complex algorithms analyzing historical data, team performance, and situational factors to calculate true probabilities
- The core principle converts probability percentages into betting odds, with bookmakers adding margins to ensure profitability
- Key probability models include Poisson Distribution for score prediction, Monte Carlo Simulation for scenario modeling, and Logistic Regression for multi-variable analysis
- Expected value (EV) is the cornerstone of profitable betting: EV = (Probability of Winning × Potential Payout) – (Probability of Losing × Stake)
How Bookmakers Calculate True Probabilities and Set Betting Lines

Bookmakers employ complex algorithms that analyze vast amounts of historical data, team performance metrics, player statistics, and situational factors to calculate the true probability of each possible outcome. The core principle is converting probability percentages into betting odds. For example, if a team has a 50% chance of winning, the fair odds would be 2.00 in decimal format (1/0.50 = 2.00). However, bookmakers add a margin (vig or juice) to ensure profitability, typically resulting in odds like 1.91 instead of 2.00.
Converting Probability Percentages to Decimal Odds with Bookmaker Margins
The mathematical conversion from probability to odds follows a simple formula: Decimal Odds = 1 / Probability. A 25% chance becomes 4.00 odds (1/0.25 = 4.00), while a 75% favorite becomes 1.33 odds (1/0.75 = 1.33). Bookmakers then apply their margin by reducing these fair odds slightly. For instance, instead of offering 2.00 on a 50-50 proposition, they might offer 1.91, creating a built-in profit regardless of the outcome.
The vig or juice concept ensures bookmaker profitability by creating an overround. In a perfect market with two equally likely outcomes, fair odds would be 2.00 for both sides. But with a 4.5% margin, both sides might be priced at 1.91, meaning the total implied probability exceeds 100% (52.4% + 52.4% = 104.8%). This excess represents the bookmaker’s theoretical profit margin.
Key Statistical Models Bookmakers Use for Probability Analysis
Poisson Distribution: This statistical model is widely used for predicting scores in sports like soccer and hockey. It calculates the probability of a given number of events occurring in a fixed interval, making it ideal for predicting goal scoring patterns. For example, if a soccer team averages 1.8 goals per game, Poisson distribution can calculate the probability of them scoring exactly 0, 1, 2, or more goals in their next match. Visualizing these probability distributions with sports betting data visualization tools can make complex statistical concepts more accessible and actionable.
Monte Carlo Simulation: Bookmakers run thousands of simulations using random variables to model different game scenarios. This helps account for the inherent uncertainty in sports outcomes and provides a range of possible results rather than single-point predictions. By simulating a game 10,000 times with varying inputs for player performance, weather conditions, and other factors, bookmakers can estimate the probability of each possible outcome more accurately.
Logistic Regression: This statistical method analyzes how multiple variables (team strength, home advantage, injuries, weather) influence the probability of a specific outcome. It’s particularly useful for complex bets involving multiple factors. Logistic regression can determine how much a star player’s absence reduces a team’s win probability, or how home field advantage affects point spreads in different sports.
Expected Value Analysis: The Mathematics of Profitable Sports Betting

Expected value (EV) is the cornerstone of successful sports betting strategy. The formula is: EV = (Probability of Winning × Potential Payout) – (Probability of Losing × Stake). This mathematical approach helps bettors identify when the odds offered by bookmakers represent value compared to their own probability assessments.
Expected Value Formula and How to Calculate Betting Edge
A positive EV indicates a potentially profitable bet over the long term. For instance, if you calculate a team has a 60% chance of winning (fair odds: 1.67), but the bookmaker offers odds of 2.00, this represents a +EV opportunity. The calculation would be: (0.60 × 2.00) – (0.40 × 1.00) = 1.20 – 0.40 = +0.80 EV per unit staked. Before committing real money, bettors should backtest sports betting strategies using historical data to validate their edge and refine their models.
Professional bettors seek out +EV opportunities where their calculated probability differs from the market price. The difference between your assessment and the bookmaker’s odds is where profit potential exists. However, even +EV bets can lose in the short term due to variance, which is why proper bankroll management is essential.
Bankroll Management and Risk Assessment in Probability-Based Betting
Understanding probability models helps bettors manage their bankroll more effectively by quantifying the risk-reward ratio of each bet. Professional bettors use these mathematical frameworks to determine optimal bet sizes based on their perceived edge over the bookmaker’s odds. This approach is similar to portfolio optimization in finance, where sports betting portfolio optimization strategies can help maximize returns while managing risk across multiple bets.
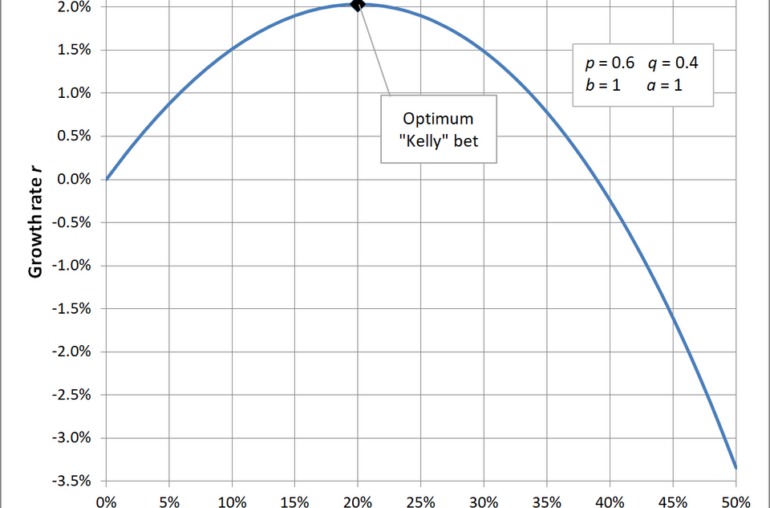
The Kelly Criterion is a popular bankroll management formula that determines optimal bet sizing based on your edge and bankroll. The formula is: f* = (bp – q) / b, where f* is the fraction of bankroll to wager, b is decimal odds minus 1, p is probability of winning, and q is probability of losing (1 – p). This helps maximize long-term growth while minimizing the risk of ruin. For a more comprehensive approach to managing uncertainty, risk assessment frameworks for sports betting provide structured methods for quantifying and managing betting risk.
Advanced Probability Models and Machine Learning in Modern Sports Betting

Modern bookmakers increasingly use machine learning algorithms and big data analytics to refine their probability models and odds calculations. These advanced systems can process millions of data points in real-time, identifying patterns and correlations that human analysts might miss.
Machine Learning Algorithms and Big Data Analytics in Odds Calculation
Machine learning models can make predictions in real time based on data from numerous disparate sources, such as player performance, weather, fan sentiment, and more. Some models have shown accuracy slightly higher than domain experts. These systems continuously learn and adapt, becoming more accurate as they process more data and outcomes. For bettors interested in building their own predictive systems, machine learning for sports betting predictions provides a comprehensive framework for developing custom models.
Real-time data processing allows bookmakers to adjust odds within seconds of new information becoming available. Player injuries, weather changes, or betting patterns can trigger immediate odds adjustments. This dynamic pricing helps bookmakers maintain their margins while providing competitive odds to bettors. For those looking to automate their betting strategies, sports betting API integration enables the creation of automated trading systems that can react to market changes instantly.
Comparing Traditional vs. Modern Probability Modeling Approaches
Traditional probability models like Poisson Distribution and Logistic Regression remain valuable for their interpretability and established mathematical foundations. These methods provide clear insights into which factors influence outcomes and by how much. Sports analysts can understand exactly why a model predicts a certain probability.
Modern machine learning approaches offer superior pattern recognition and can adapt to changing conditions more quickly, but may lack the transparency of traditional methods. Deep learning models might identify complex interactions between variables that traditional statistics miss, but they often operate as “black boxes” where the reasoning behind predictions isn’t easily explained.
The integration of these technologies means that the gap between bookmaker models and sharp bettor models is narrowing, making it increasingly difficult to find +EV opportunities. Success now requires not just understanding probability theory, but also having superior data analysis capabilities and faster information processing.
The most surprising finding is that the gap between bookmaker odds and true probabilities is often smaller than bettors realize, making value betting extremely difficult. Start by calculating your own probabilities for simple bets before attempting complex multi-factor analysis. Understanding sports betting market microstructure and liquidity analysis can help bettors better understand how odds move and where value might exist in different betting markets.