Week 15 has seen the cryptocurrency market navigating moderately positive sentiment. The leading digital asset, Bitcoin, experienced a modest 0.2 percent increase. In contrast, Ethereum demonstrated significant strength, climbing over 10 percent within the week, largely propelled by the successful Shapella (Shanghai + Capella) upgrade.
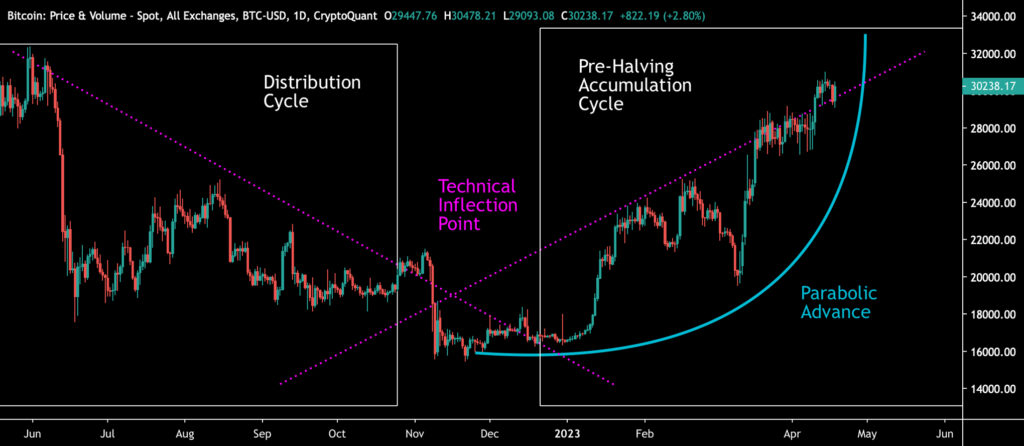
From a purely technical standpoint, Bitcoin crossed a pivotal inflection point at the year’s commencement. This juncture, where descending and ascending trend lines converge, acts as a critical watershed, delineating market phases from 2021 through to the 2024 halving year.
Concurrently, Bitcoin has established a parabolic trendline since December 2022. However, the increasing steepness of this parabola suggests a need for more substantial price surges to maintain its trajectory. A breach of this upward curve during the spring could introduce short-term selling pressure.
Sources: Timo Oinonen, CryptoQuant
Understanding Market Cycles
On a broader scale, Bitcoin’s market behavior can be viewed through the lens of accumulation and distribution phases. These phases collectively form multi-year cycles. Historically, institutional capital has gravitated towards accumulation periods, while retail investors tend to be more active during distribution phases. Bitcoin’s history is also intrinsically linked to halving events, which are consistently preceded by a pre-halving accumulation cycle.
Material Indicators’ heat map provided insight into a brief dip from $30,000 to $29,000 at the week’s start, coinciding with the disappearance of a significant buy wall. However, fresh buying interest emerged below the $30,000 mark, successfully pushing Bitcoin back above this level. Currently, a moderate sell wall is observed above $31,000.
Bitcoin’s Bollinger Bands, which had previously squeezed the price upwards, now suggest an expansion phase is imminent. This typically involves a period of sideways price movement before a significant directional move.
Sources: Timo Oinonen, CryptoQuant
Ethereum’s Momentum and Altcoin Stirrings
The anticipated selling pressure surrounding Ethereum’s upgrade did not materialize, and the asset is now clearly outperforming other large-cap cryptocurrencies. The market for smaller tokens is also showing signs of life, with Chainlink (LINK) surging nearly 17 percent this past week. Litecoin (LTC) has seen an 8 percent gain and is approximately 100 days away from its halving event.
In comparison, traditional markets have seen more subdued performance. The S&P 500 index edged up by one percent, while gold saw a slight decline of about half a percent. The technology-heavy Nasdaq-100, however, has experienced a strong tailwind in April, registering gains of over 20 percent year-to-date.
7-Day Price Performance Snapshot
Bitcoin (BTC): 0.2%
Ethereum (ETH): 10.8%
Litecoin (LTC): 7.7%
Aave (AAVE): 3.1%
Chainlink (LINK): 16.7%
Uniswap (UNI): 6.1%
Stellar (XLM): 0.2%
XRP: 2.0%
S&P 500 Index: 1.1%
Gold: -0.6%
Bitcoin’s UTXO Pattern Echoes 2020
Bolstered by recent price action, Bitcoin is now exhibiting a divergence from the realized price’s turquoise wave, which served as a critical support level between late 2022 and early 2023. The realized price, representing the average cost basis of all Bitcoin transactions, is often seen as a market barometer. When the spot price surpasses the realized price, it indicates that Bitcoin holders are, on average, in profit.
Historically, the realized price’s UTXO waves have been a reliable indicator of Bitcoin’s market bottoms. In 2019, the crossover where the 6-month to 12-month UTXO wave fell below the 12-month to 18-month wave signaled a market bottom. This same pattern repeated in 2020. Crucially, this structure reappeared at the close of 2022, with the 6M-12M wave clearly descending below the 12M-18M wave, and their divergence widening. This confluence of UTXO waves in late 2022 strongly suggests a confirmed market bottom.
Sources: Timo Oinonen, CryptoQuant
The current setup mirrors that of 2020, where the 6M-12M realized price wave intersected with the spot price from below. The chart illustrates this 2020 pattern on the left (green area) and the present situation on the right. The outcome of that 2020 intersection was a significant parabolic rally that extended well into 2021.
Bitcoin Dominance and the Altseason Question
With Bitcoin achieving nearly 100 percent year-to-date gains, many market participants are keenly observing alternative cryptocurrencies, or altcoins. While Bitcoin’s relative dominance has grown this spring, its upward momentum is likely capped around the 50 percent mark.
In recent years, Bitcoin’s dominance has consistently found resistance at 50 percent, largely due to increased retail participation during bull cycles. As Bitcoin gains significant traction, demand for altcoins often rises in correlation, leading to market saturation and a stabilization of Bitcoin’s dominance. These conditions are typically precursors to an “altseason.”
While the efficient market hypothesis suggests asset prices reflect all available information, speculative assets like cryptocurrencies often deviate. Information asymmetry can exist, where certain parties possess superior insights. Furthermore, newer crypto investors are often drawn to novel tokens, valuing their perceived uniqueness.
Despite Ethereum’s Shapella upgrade exceeding expectations, it has not yet triggered a “flippening” scenario where it overtakes Bitcoin in market capitalization. Currently, Ethereum’s market cap stands at approximately $250 billion, representing 42.7 percent of Bitcoin’s substantial $588 billion market cap.
Triple Bottom Structure Prediction Validated
Our previously presented triple bottom structure, based on the number of active addresses, has now been clearly confirmed. In the technical analysis from week nine, we highlighted this model, and the graph of active addresses (white) has indeed moved beyond the turquoise area.
On-chain data from 2018 and 2019 reveals how the 30-day weighted moving average (30WMA) of active addresses formed three distinct bottoms (turquoise, left) during the 2018-2019 market reversal. The current 2021-2023 cycle exhibits a strikingly similar pattern (turquoise, right), with active addresses also reaching three individual lows.
Sources: Timo Oinonen, CryptoQuant
The decline in active addresses began as early as the summer of 2021, effectively serving as a leading indicator for the spot price. This suggests that the price action in spring 2021 represented a fundamental peak, while the November 2021 peak could be considered secondary.
In conclusion, with Bitcoin’s price action aligning with the triple bottom structure observed in the previous major cycle, a gradual price appreciation throughout 2023 appears probable. Bitcoin’s current “fair price” is estimated at $38,736, aligning with our projection of $46,092.
Current Market Observations
Solana Mobile has announced that its Saga smartphone will begin shipping on April 20th. Priced at $1,000 in the USA (approximately €912 in the Eurozone), the device’s functionality and ecosystem are being highlighted by Solana.
New Saga owners will receive an NFT, the Saga Genesis token, which is intended to grant access to exclusive content and offers. Additionally, Saga users are promised a starter pack containing 20 USDC and 0.01 SOL tokens for transaction purposes. We are closely monitoring the development of this crypto-native smartphone.
In a recent interview with Kitco, investment expert Lawrence Lepard shared his perspective on Bitcoin, suggesting it could reach $100,000 next year.
Bitcoin pioneer Matthew Mezinskis, host of the Crypto Voices podcast, discussed how central banks have historically hindered free banking and shared his insights on the credit market’s current state.