The cryptocurrency landscape has shown a generally positive trend over the past week, with Bitcoin experiencing a modest uptick of 0.2 percent. However, it was Ethereum that truly stole the spotlight, surging over 10 percent, largely propelled by the successful Shapella (Shanghai + Capella) network upgrade. This event has clearly demonstrated the market’s responsiveness to significant technological advancements.
Navigating Bitcoin’s Technical Landscape
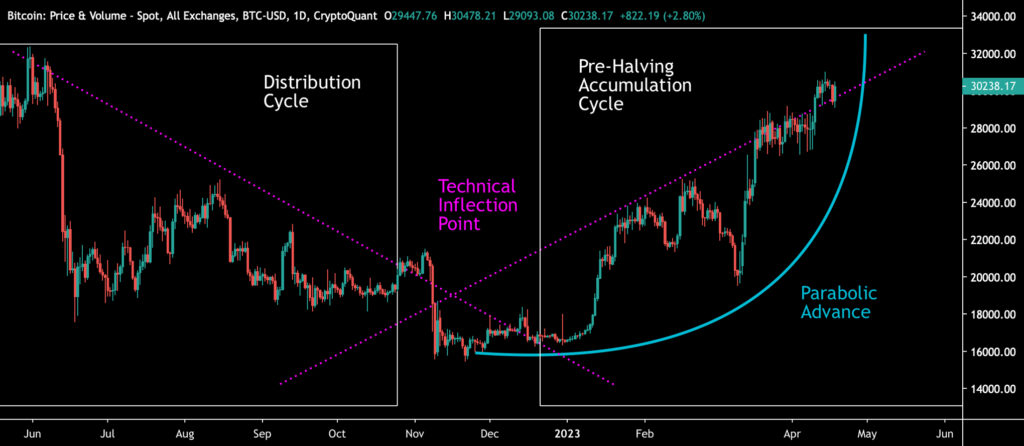
From a technical standpoint, Bitcoin crossed a pivotal point at the year’s start. This intersection of descending and ascending trend lines, which I’ve seen act as a critical juncture before, effectively divides the market’s behavior from the 2021 bull run through to the anticipated 2024 halving cycle. It’s the kind of level that traders watch closely for shifts in sentiment.
Simultaneously, Bitcoin has been carving out a parabolic ascent since December 2022. What’s notable now is the increasing steepness of this parabola. This acceleration demands more significant price jumps to maintain the trend. A break below this upward curve in the coming weeks could certainly introduce some short-term selling pressure, a pattern we’ve observed before when such rapid ascents falter.
Sources: Timo Oinonen, CryptoQuant
Looking at the larger market cycles, Bitcoin’s history is characterized by distinct accumulation and distribution phases. These multi-year cycles are often influenced by major events like the halving, which typically precedes a pre-halving accumulation period. Institutional investors tend to favor these accumulation phases, while retail participation often swells during distribution periods.
Understanding Order Book Dynamics
Material Indicators’ heat map provides a granular view of order book activity. We saw a brief dip from $30,000 to $29,000 when a significant buy wall evaporated. However, the market quickly found new support below the $30K mark, pushing the price back up. Currently, a moderate sell wall sits above $31,000, a level to watch for potential resistance.
Bitcoin’s Bollinger Bands also offer clues. After a period of contraction, often referred to as a ‘BB Squeeze,’ which tends to precede significant price moves, we’re now seeing the bands widen. This expansion phase often involves more sideways price action as the market consolidates before the next directional move.
Sources: Timo Oinonen, CryptoQuant
Ethereum’s Strength and Altcoin Stirrings
The anticipated selling pressure around Ethereum’s upgrade didn’t materialize, and ETH is now leading the charge among major cryptocurrencies. This positive momentum appears to be spilling over into smaller cap tokens. Chainlink, for instance, saw an impressive nearly 17 percent gain this past week. Litecoin, with its halving event approximately 100 days away, also posted a solid 8 percent increase.
In contrast, traditional markets have seen more subdued performance. The S&P 500 index edged up by 1 percent, while gold saw a slight decline of about 0.5 percent. The Nasdaq-100, however, has been a strong performer in April, climbing over 20 percent year-to-date, indicating a broader tech sector recovery.
7-Day Price Performance Snapshot
Bitcoin (BTC): 0.2%
Ethereum (ETH): 10.8%
Litecoin (LTC): 7.7%
Aave (AAVE): 3.1%
Chainlink (LINK): 16.7%
Uniswap (UNI): 6.1%
Stellar (XLM): 0.2%
XRP: 2.0%
S&P 500 Index: 1.1%
Gold: -0.6%
Bitcoin’s UTXO Pattern Echoes 2020
Bitcoin’s current price action is showing a fascinating divergence from the realized price’s turquoise wave. The realized price, which represents the average cost basis for all Bitcoin holders, has historically served as a crucial support level. When the spot price trades above the realized price, it signifies that, on average, investors are in profit – a healthy sign for market sentiment.
The UTXO (Unspent Transaction Output) waves, segmented by age, have been reliable indicators of market bottoms. We saw this pattern in 2019 and again in 2020, where the 6-month to 12-month wave crossed below the 12-month to 18-month wave. This same structure reappeared at the close of 2022, with the divergence between these waves strongly suggesting a market bottom was in place.
Sources: Timo Oinonen, CryptoQuant
The current setup strongly resembles the conditions seen in 2020. In that year, the 6M-12M realized price wave intersected with the spot price from below, leading to a significant parabolic rally that extended well into 2021. The chart clearly illustrates this parallel, with the green area on the left representing 2020 and the current situation on the right.
Bitcoin Dominance and the Altcoin Season Question
With Bitcoin’s impressive year-to-date gains, many in the market are now turning their attention to altcoins, anticipating a potential ‘altseason.’ While Bitcoin’s dominance has strengthened this spring, I believe its upward trajectory is likely capped around the 50 percent mark.
Historically, Bitcoin’s dominance has struggled to break decisively above 50 percent, particularly during bull cycles fueled by retail investor interest. As Bitcoin gains significant momentum, demand often shifts to altcoins, leading to market saturation and a stabilization of Bitcoin’s dominance. This dynamic is a key ingredient for the emergence of an altseason.
While the efficient market hypothesis suggests all information is priced in, the reality in speculative markets like crypto often differs. Information asymmetry exists, and newer investors are frequently drawn to the novelty of emerging tokens. This can create opportunities for those who understand these market dynamics.
Despite the success of Ethereum’s Shapella upgrade, a ‘flippening’ scenario where ETH overtakes Bitcoin in market capitalization is not imminent. Ethereum’s market cap currently stands at approximately $250 billion, representing about 42.7 percent of Bitcoin’s $588 billion market cap. Bitcoin continues to hold its dominant position.
Our Triple Bottom Prediction Confirmed
The triple bottom structure we highlighted based on active addresses has now been clearly confirmed. In our previous analysis (week nine), we presented this model, and the graph of active addresses has indeed moved beyond the predicted turquoise area.
Looking back at 2018-2019, the 30-day weighted moving average of active addresses formed three distinct bottoms. The current 2021-2023 cycle mirrors this pattern, with active addresses hitting three separate lows. This historical parallel is a strong indicator.
Sources: Timo Oinonen, CryptoQuant
The decline in active addresses began in the summer of 2021, acting as a leading indicator for the spot price. This suggests that the price peak in spring 2021 was more fundamentally supported, while the November 2021 peak might have been a secondary, less sustainable high. Given that Bitcoin is now following a similar triple bottom structure to the previous major cycle, a gradual price increase throughout 2023 seems probable. Our projection for Bitcoin’s fair price is currently around $38,736, aligning with our latest forecast of $46,092.
Key Developments to Monitor
Solana is set to begin shipping its Saga smartphone on April 20th. Priced at $1000 in the US (approximately €912 in the Eurozone), the device comes with an exclusive ‘Saga genesis token’ NFT, promising access to unique content and offers. New owners will also receive a starter pack including 20 USDC and 0.01 SOL for transaction fees. We are closely watching the adoption and impact of this crypto-native smartphone.
Investment expert Lawrence Lepard recently shared his outlook on Bitcoin with Kitco News, suggesting it could reach $100,000 next year. He discussed the potential for a U.S. dollar collapse and the rollout of central bank digital currencies (CBDCs).
Matthew Mezinskis, host of the Crypto Voices podcast, shared his perspective on the historical limitations of central banking and how Bitcoin fundamentally alters the system. He also discussed the current state of the credit market.